In December 2019 a new coronavirus started spreading in Asia. Not contained, this virus and the COVID-19 disease it led to, engulfed societies around the world. Many communities including those at UBC were affected, with extreme social distancing and self-isolation measures coming into place. During this difficult time our group attempted to apply some of the tools they had developed towards helping combat the COVID-19 pandemic.
Inference in Epidemiological Models
We used PyProb, the tool developed by members of our group, to perform inference in epidemiological models that are used to describe the spread of infectious diseases like COVID-19. In most cases policy analysts have to manually adjust these models or do parameter sweeps. Our aim was to automate the policy exploration process, helping policy analysts come up with more optimal policy recommendations.
To this end, we used both compartmental and agent-based models of physiology to study the spread of COVID-19-like diseases, and the impact that interventions such as school closures might have on the spread of the disease and the healthcare system.
To demonstrate the use of this system, we have developed the Automated Pandemic Response Profiler, a tool which helps users identify suitable interventions to combat COVID-19 in different geographic locations.
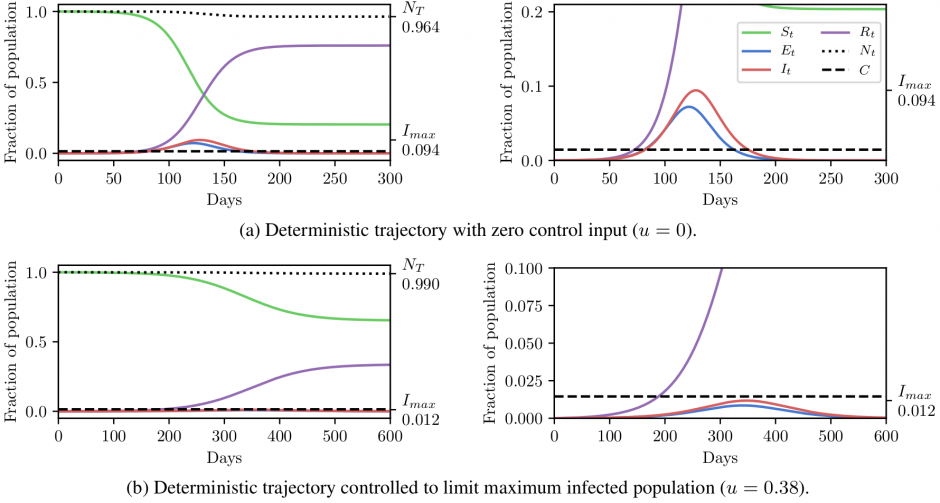
Populations per compartment during deterministic SEI3R simulations, both without intervention (top) and with intervention (bottom). Plots in the left column show the full state trajectory, and in the right column are cropped to more clearly show the exposed and infected populations. Without intervention, the infected population greatly exceeds the limit (0.0145, black dashed line) for a period, overwhelming hospital capacities. With intervention, the infected population always remains below this limit.
Stochastic SEI3R in a model predictive control setting. At each step, our method solves for the minimum required control such that the constraint is satisfied. We plot the 90% confidence interval over trajectories conditioned on this control value. We then step through the system, randomly sampling continuations, and adapting the controls used such that the constraint is always met. We uncover that the amount of control required reduces over time as herd immunity comes into effect. (red) Infected, (blue) Exposed (purple) Recovered.
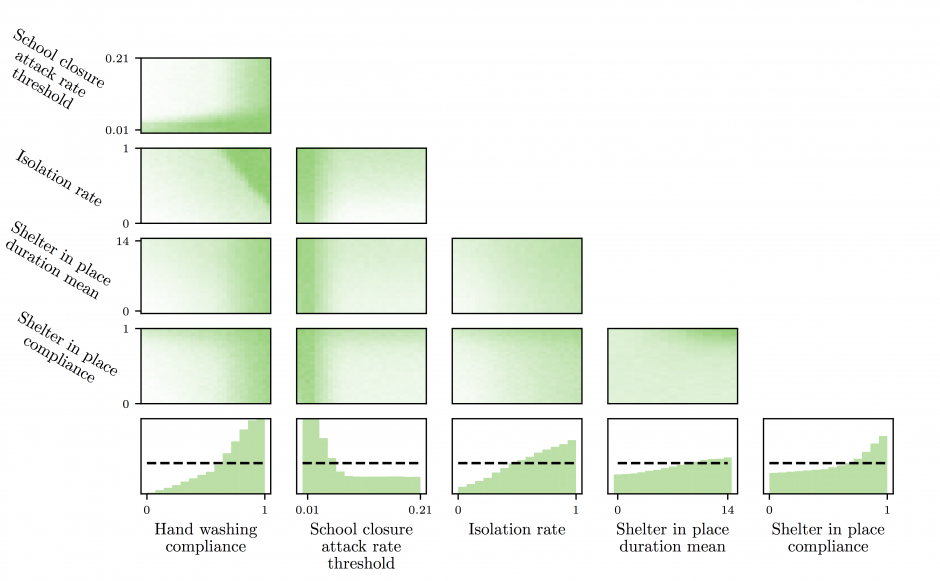
Array of 2D histograms showing two-dimensional marginal distributions over controllable policy parameters that give rise to appropriately controlled outcomes in Allegheny county. Marginals for each policy are shown in the bottom row, with the number of samples from the uniform prior indicated by the dashed line. We can clearly see the efficacy of high rates of hand washing and a quick school closure policy, as indicated by the non-uniformity of the marginal distributions.
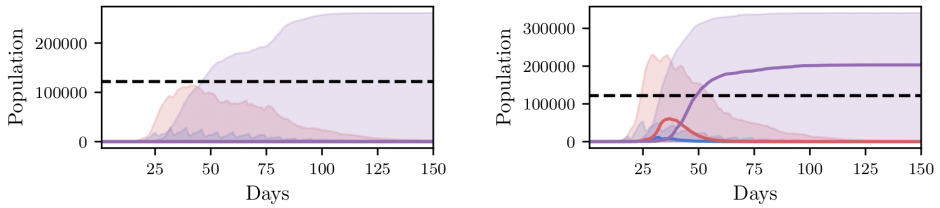
SEIR statistics extracted from a FRED simulation of an *influenza* (not COVID-19) outbreak in Allegheny County. (left) controlled scenarios keeping the number of infectious people below 10% (black dotted line), and (right) uncontrolled scenarios. We plot the median and confidence bands between 3rd and 97th percentile. On the left the confidence interval for infectious people (red) stays below our constraint, verifying that all controlled runs follow our policy, while the confidence band for the uncontrolled scenarios violates our policy constraint.
Progression of a simulated influenza epidemic in Allegheny county under controlled (left) and uncontrolled (right) scenarios. Each red dot represents a household with at least one infected resident. We see a control policy focusing on hygiene, rapid school closures, and isolation of symptomatics “flattens the curve” by slowing the onset of the virus.